DataCards – Decision intelligence for engineering and management

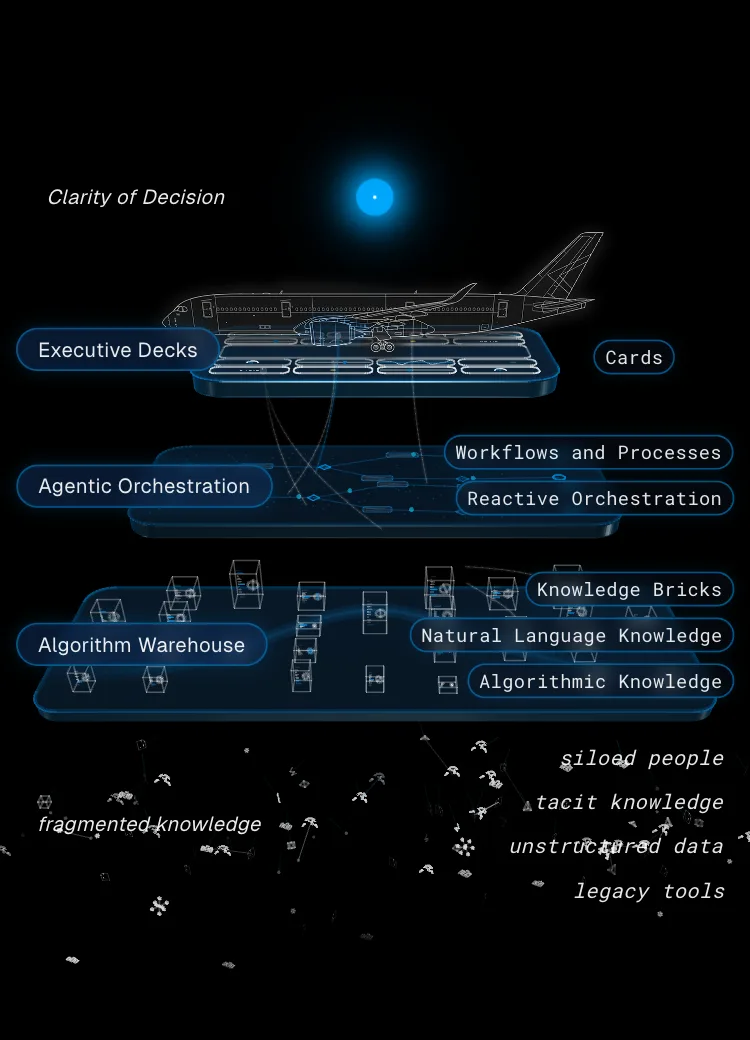
The DataCards layers: an aircraft above the Executive Decks, the Agentic Orchestration layer and the Algorithm Warehouse, built on fragmented knowledge

Trusted by engineering teams in sectors like aviation, automotive, energy and research, including:

Rolls-Royce
Land Brandenburg
DLR – German Aerospace Center
Deutsche Bahn
Vattenfall
Timpla
Federal Ministry of Research, Technology and Space
Humboldt-Universität zu Berlin and TUM

What is decision intelligence?

Decision Intelligence Platform

Decision intelligence for engineering and management.

Making decisions with more data and knowledge, better connected and in context. Every framework has the same layers, and each layer turns one thing into the next. DataCards is one opinion on how to build them, for engineering.

1. Data foundation — internal and external, structured and unstructured sources become one trusted context.
At DataCards: knowledge defragmentation. Not only data, also the knowledge scattered in tools, code and heads.

2. Analytics layer — data becomes decision services.
At DataCards: the Algorithm Warehouse. Rules, physical models and analyses as documented, executable, versioned services.

3. Orchestration layer — decision services become decision models.
At DataCards: reactive AI orchestration. When an input changes, every dependent decision recomputes.

4. Decision layer — models become insight.
At DataCards: the Executive Decks. Scenarios, simulations, live data, every number traceable to its source.

5. Governance layer — insight becomes governed impact, and feeds the next iteration.
At DataCards: the decision lifecycle. Versions, monitoring, audit. Design iterations, as in aerospace: each decision makes the next one better and faster.

Ad hoc vs. governed

What breaks when decisions
stay ad hoc.

Ad hoc works. Pull the files together, ask the AI, decide. It is fast and it feels smart. But the model behind that decision is thrown away. Six months later, the auditor asks why, or a similar question comes up, and the archaeology starts again. A chat plus a folder plus a workflow tool gives you answers. It does not give you a system that learns.

Ad-hoc AI decisions
Governed decisions
Files pulled together for one question
One shared decision model
Throwaway model, gone after the chat
Versioned decision services
Start from zero and hope the AI remembers something
Reused and refined, iteration by iteration
Nobody can say why, six months later
Traceable to the source, audit-ready
Workflow glue around a chat
Humans decide, agents assist inside guardrails
Ungoverned
Governed

The Decision Lifecycle.

  1. Model

    Experts capture their knowledge as decision services: rules, physical models and analyses, documented, executable and versioned in the Algorithm Warehouse.

  2. Composition

    AI agents compose services into decision models and reactive workflows that update whenever an input changes, with engineers in the loop.

  3. Decision

    Executive Decks show scenarios, simulations and live data. Every number is traceable to the logic and the expert behind it.

  4. Learning

    Every decision feeds the next. Models are refined, services replaced, heuristics deepened, iteration by iteration.

T-shaped knowledge

Depth and breadth.
One shared workspace.

Good engineering decisions need both: the depth of specialists who hold the knowledge, and the breadth of generalists who carry the responsibility. In DataCards, specialists model decision services in the Algorithm Warehouse: proud to share. Generalists combine them in Executive Decks and decide, with the deep dive always one step away.

  • specialists
  • generalists
  • algorithm warehouse
  • executive decks
  • cards
  • scenarios
  • what-if analysis
  • simulation
  • live data
  • digital twins
  • shared line of sight
T-shaped knowledge: the breadth of responsibility of generalists in the Executive Decks meets the depth of knowledge of specialists in the Algorithm Warehouse. BREADTH OF RESPONSIBILITY DEPTH OF KNOWLEDGE ALGORITHM WAREHOUSE EXECUTIVE DECKS Generalist Specialist execute implement

Decision execution

One graph. Every dependency visible. Every update automatic.

Decision services publish and consume data products, forming a reactive dependency graph. When any input changes, every dependent decision recomputes automatically. No stale numbers, no manual re-runs.

Humans and agents

Faster because it’s governed,
not despite it.

AI agents in DataCards act only on validated logic and inside clear guardrails. They show their reasoning, humans check, correct and approve, and every correction becomes knowledge the platform keeps. That is what makes decisions fast: nobody has to rebuild trust from scratch.

  • humans and agents
  • guardrails
  • explainable reasoning
  • approval before action
  • model-agnostic
  • corrections become knowledge
  • reactive knowledge graph
  • multi-level agents
  • structured outputs
  • hallucination guard

Traceability

Every output has a paper trail.
Every decision is explainable.

When your auditor asks how a number was calculated, the answer is a click-through to the exact notebook — reasoning and code, side by side.

Architecture

Runs in your cloud.
Enterprise-ready by design.

Bring your own cloud, or use ours in the EU. Every project runs in its own isolated microVM inside your VPC, and your data stays where it is. Postgres, S3-compatible storage, Git, SSO, monitoring: building blocks your IT already trusts, with the same governance and audit trail everywhere. Not a science project. A platform your IT can sign off on.

  • BYOC
  • SaaS
  • on-premise
  • EU hosting
  • data residency
  • SSO
  • roles & permissions
  • audit-ready
  • isolated microVMs
  • git
  • API-first

What management gets

Speed. Consistency.
Confidence.

Three things management asks of every decision, and one that keeps them true over time. Behind them: decisions that are coherent, contextual, connected, compliant, cost-optimised, collaborative and continuous.

Speed

From months to minutes. Decision services are ready to run, scenarios on demand.

Consistency

Same question, same answer. Versioned logic and one shared model across teams.

Confidence

Show why. Every result is explainable and traceable to its source.

Continuity

Every decision feeds the next. Corrections become knowledge, models improve.

Industries

Proven in aviation.
Piloting in space, maritime and energy.

Aviation · Case study

Virtual Jet Engine Twin. How Rolls-Royce models design decisions with DataCards: from R&T development twins for new engine generations to maintenance twins mirroring the active fleet.

Space · Pilot

Space weather, satellites and mission planning. Decision services that connect component partners and consortia across the mission lifecycle.

Energy · Pilot

Grid and generation assets. Operational decisions across engineering and management, from asset health to scenario planning. Built environment and critical infrastructure: talk to us.

Maritime · Pilot

Ship and fleet. Design, service cycles and material loads in one shared decision model for yards, operators and research.

Case studies.

deutsche bahn

Turning complex
data into better service.

For Deutsche Bahn, we conceived and developed several DataCards projects that creatively consolidated existing data sources into actionable insights.

These insights help improve galley management and maintenance inside the newest ICE4 trains, making them more efficient and less error-prone.

#conception #development #data culture

Rolls-Royce PLC

Digital Jet Engine Twin.
Deep Tech at Finger Tips.

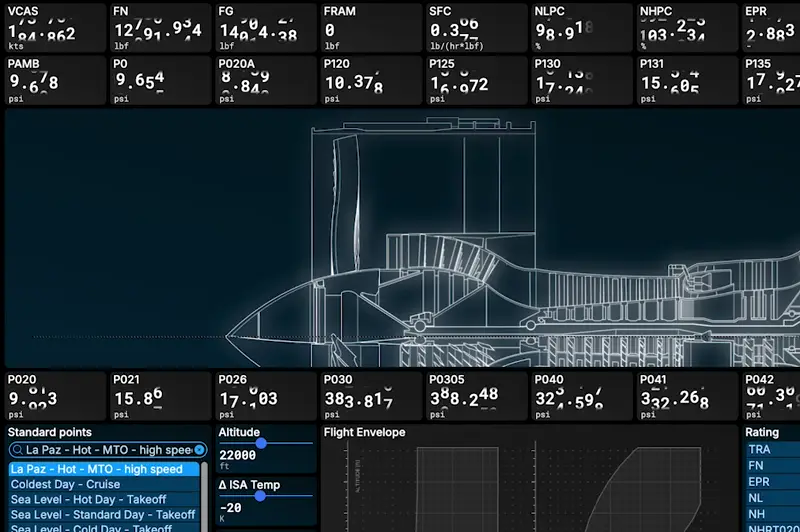
Simulating 600 parameters of a Jet Engine in real time - the Virtual Jet Engine (VJE) exposes an intuitive-to-use frontend to a wide and heterogeneous range of stakeholders. This enables knowledge provision through the research and development process across several departments at Rolls-Royce. The ‘Distans’ Industrial Research funded by Land Brandenburg co-funded by the European Union. The VJE User Experience makes complex aviation simulation data understandable to a broad range of stakeholders around the globe. Fostering communication between experts and stakeholders is key for efficient innovation, driven by data. Cavorit co-created the VJE with Rolls-Royce Jet Engines to fasten iteration cycles, boosting return of investment.

#conception #design #development

Virtual Jet Engine deck: live engine parameters above the engine schematic
0:08 The deck: engine schematic, 40 live parameters
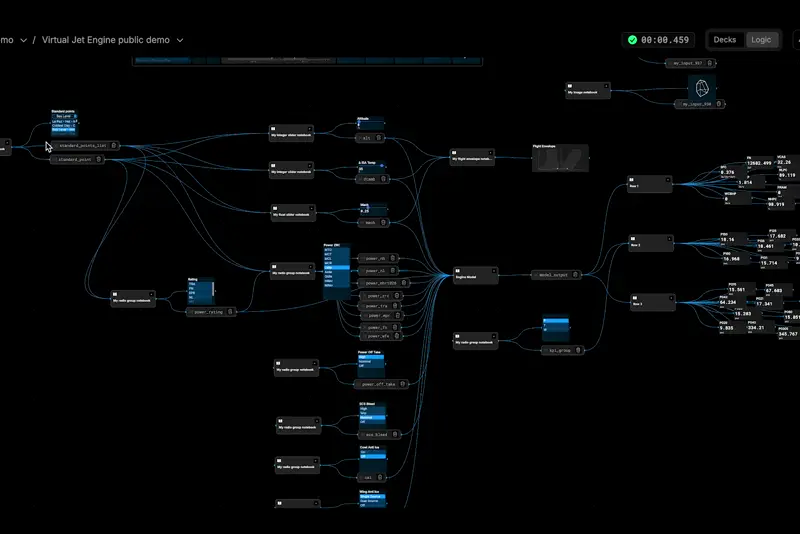
The process graph behind the deck: decision services connected to the engine model
1:08 The process graph behind the deck
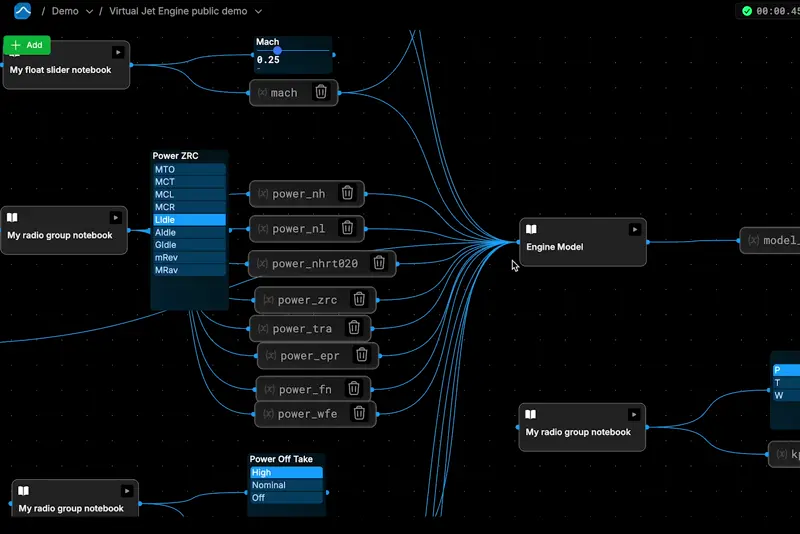
The Engine Model node with its input sliders and radio groups wired in
1:14 Engine Model node and its inputs
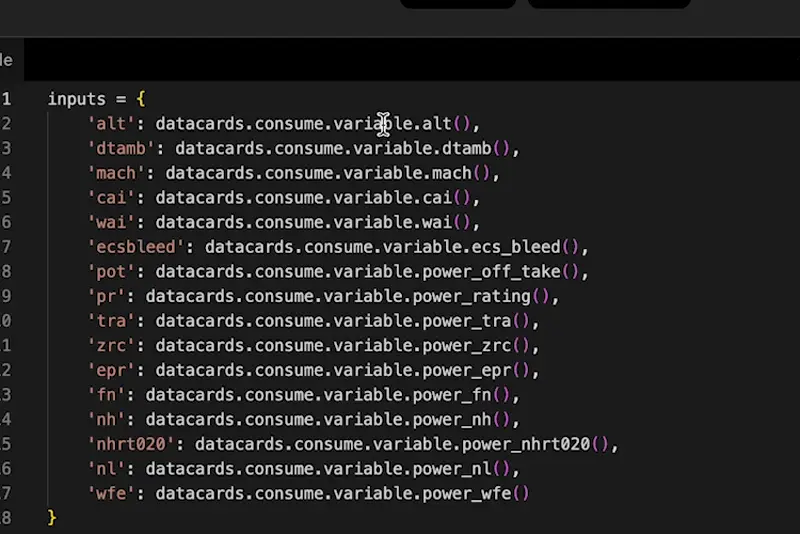
The Engine Model notebook: the code that consumes the inputs
1:20 Engine Model notebook: the code
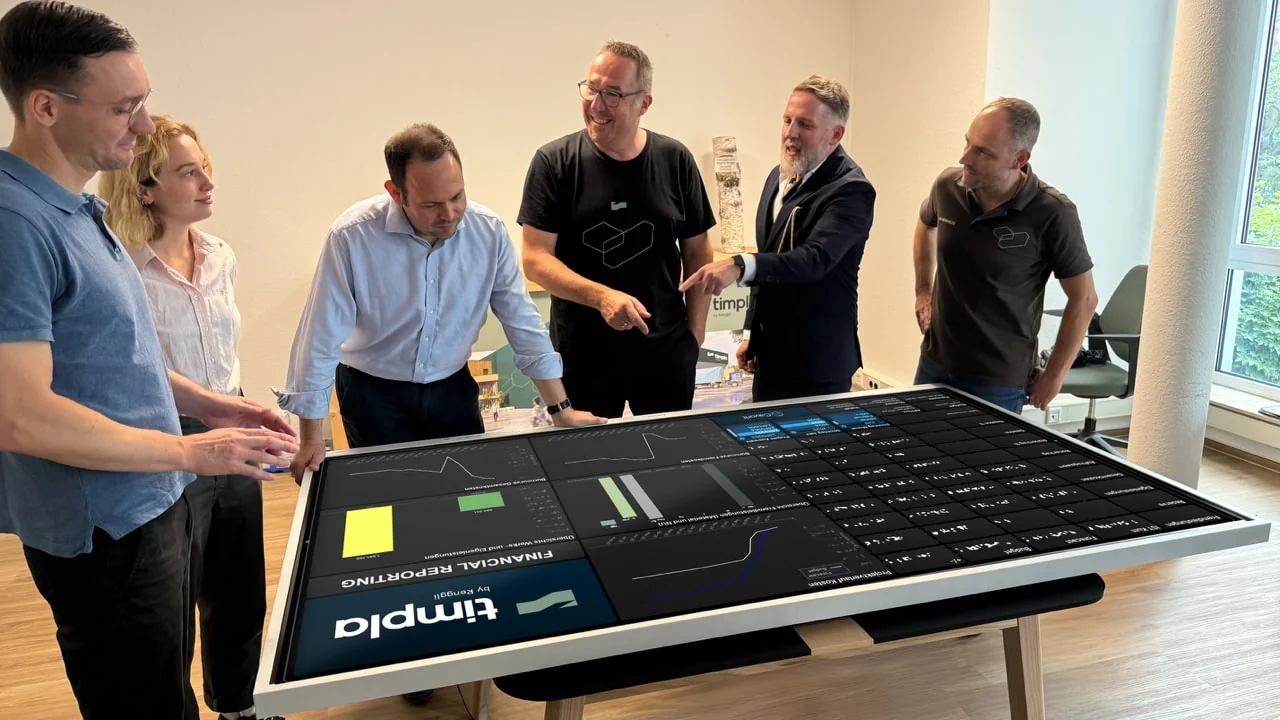
Timpla

Optimise financial planning by orchestrating legacy tools.

To support Timpla’s mission of simplifying sustainable building planning, we developed a custom dashboard that brings clarity and speed to their operations.

By consolidating multiple disconnected sources into a single, dynamic interface — including live data integrations — the new system enables faster insights, better collaboration, and more confident decisions across teams.

#conception #design #development #datacards

People gathered around a screen showing a DataCards dashboard.

experimental research

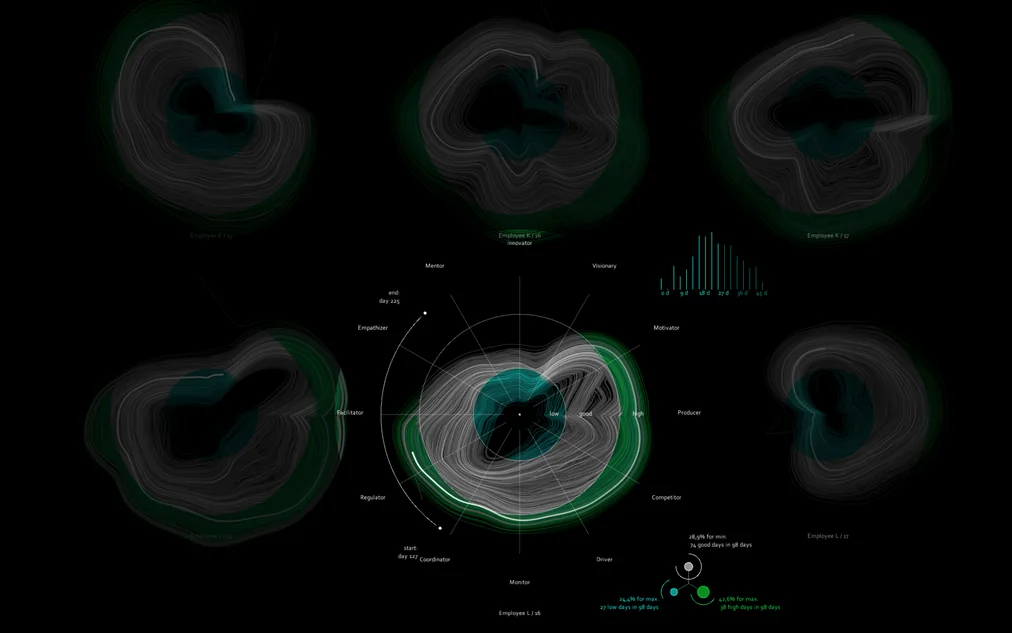
Probabilistic Wind Avatars

Wind energy operations demand clarity across a wide range of decisions, from portfolio risk assessment and site selection to maintenance planning under volatile conditions. We developed a DataCards solution that visualises circular wind statistics as intuitive, probabilistic avatars.

By leveraging advanced sampling methods such as Gibbs-Sampling and Metropolis-Hastings under the hood, the platform empowers stakeholders to focus on visual insights and confident decisions, without needing expertise in probabilistic statistics. From forecasting models to small sample analysis, complex wind data becomes actionable at a glance.

#conception #research #datacards

DataCards Demos.

Live demos, one per industry. Real data, real decks, recorded in one take.

Space · Live demo

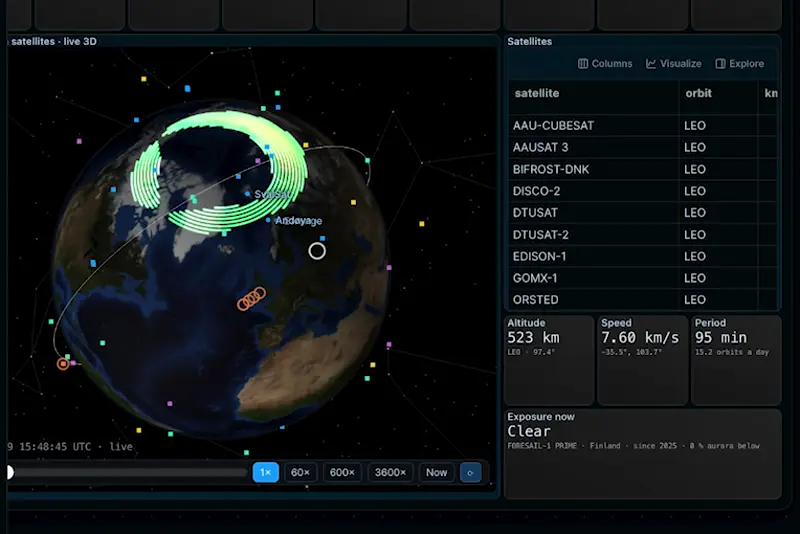
Space weather, satellites and debris on one deck.

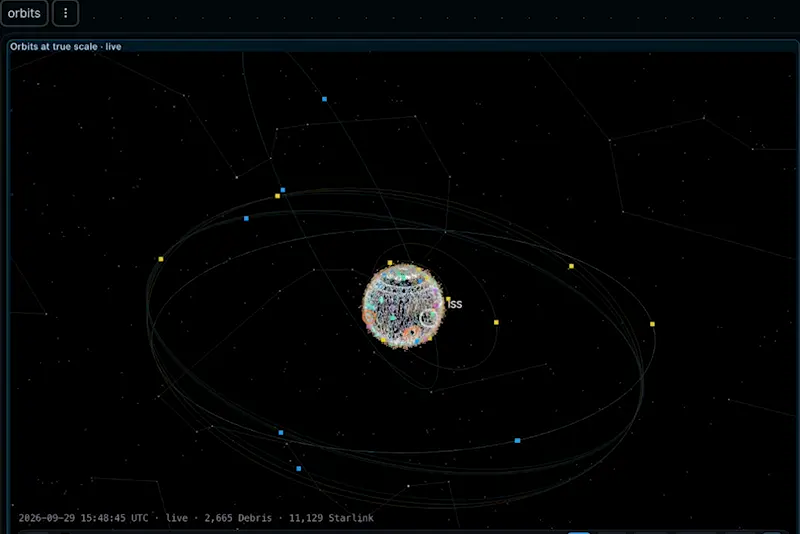
Every Scandinavian satellite and the Starlink constellation in orbit at true scale. The geomagnetic situation where you are, and where you will be an hour from now. Live footage of the sun. Debris by altitude.

Decks refresh once a second, and every number is rooted in code: versioned, traceable, re-executable in the notebook network below the decks. Agents assist with orbit planning and maintenance schedules. At the end, a QR code hands the executive summary to everyone in the room.

#space #live data #orbits #agents #t-shaped knowledge

2:18 min · narrated, subtitles EN/DE

Satellites live in 3D over the aurora oval, with the satellite table
0:30 Satellites live, aurora oval
Orbits at true scale with debris and Starlink
0:36 Orbits at true scale
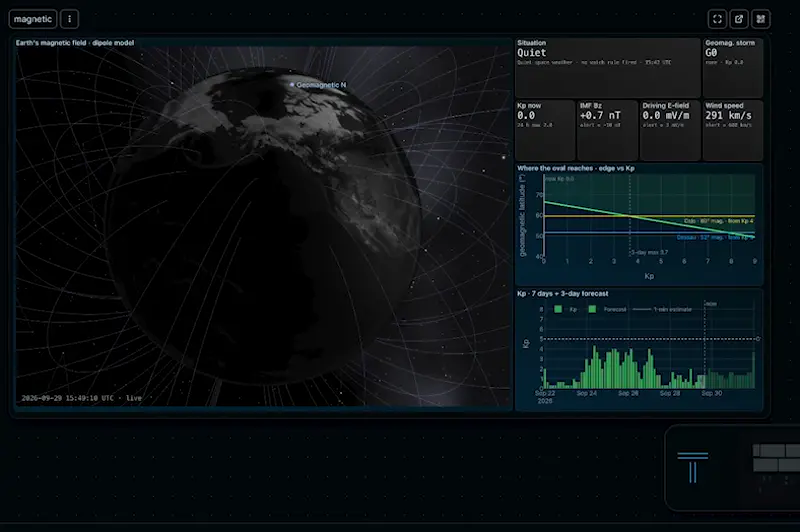
Geomagnetic situation and Kp forecast
0:48 Geomagnetic situation, Kp forecast
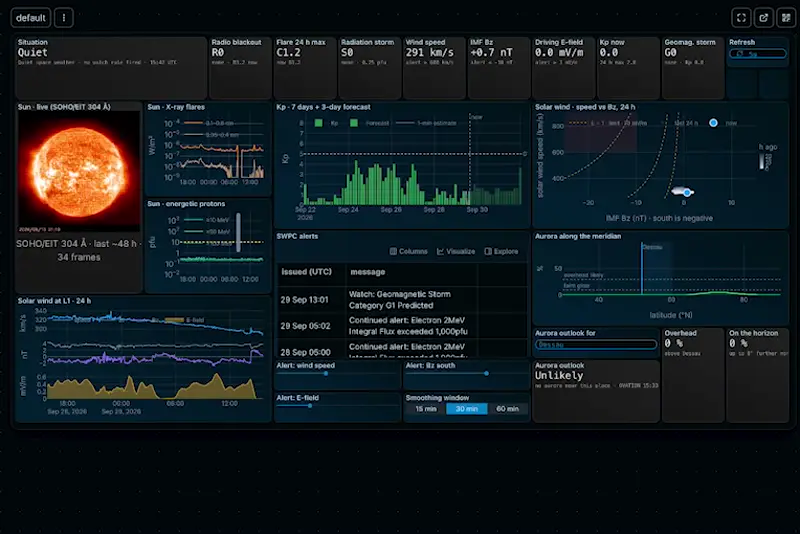
Live sun, solar wind and NOAA alerts
0:54 Sun, solar wind, alerts

Maritime · Live demo

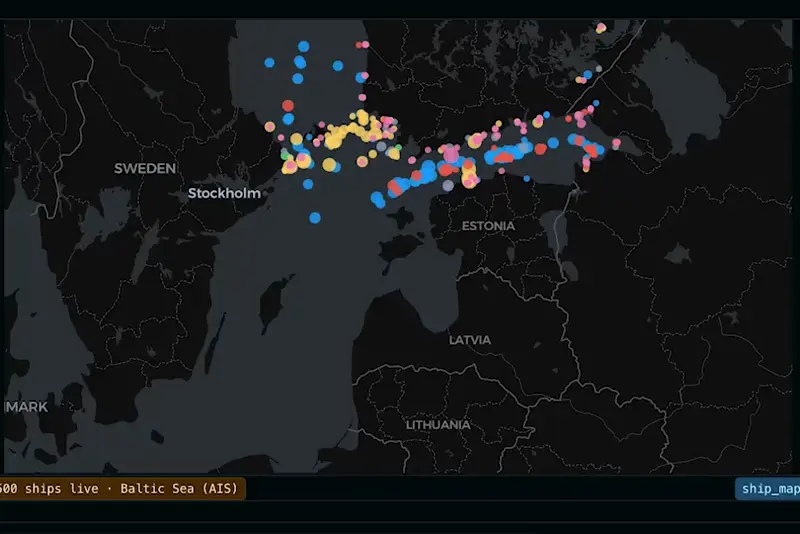
Live ocean currents and 500 ships. Built in 30 minutes.

Surface currents across the Atlantic, sea-surface temperature, transport rankings by current, and the live positions of 500 ships from the Baltic to the Cape. Built in a 30-minute hackathon on real data, with an AI pairing skill writing the notebooks.

Every value drills down to its source: 9.5 knots? Click, read the code, re-execute. Every change is version-controlled, and every deck also runs on a phone and on a smartwatch.

#maritime #ships #ocean data #drill-down #30 minutes

3:32 min · narrated, subtitles EN/DE

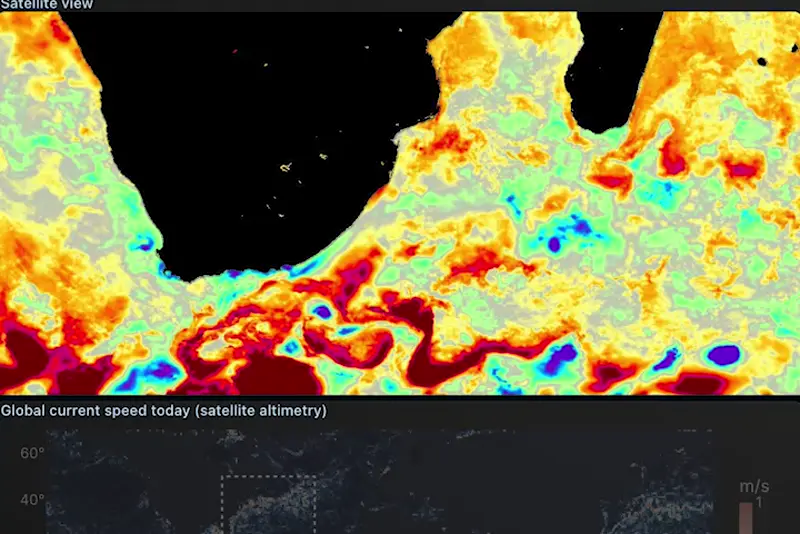
Sea-surface temperature from satellite, Cape of Good Hope
0:40 Sea-surface temperature
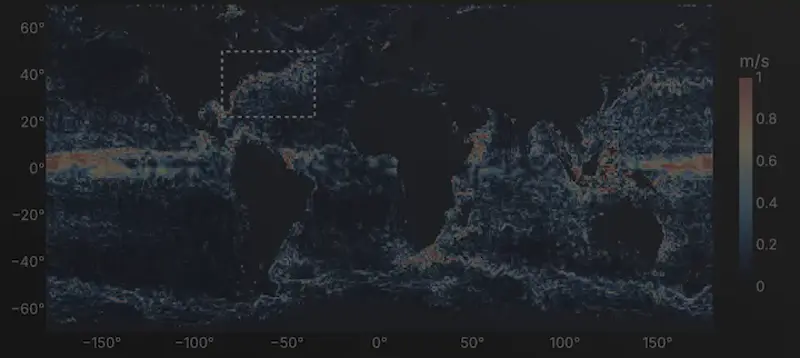
Global current speed today from satellite altimetry
0:45 Global current speed
500 ships live in the Baltic Sea
0:55 500 ships live, Baltic Sea

Built environment · Live demo

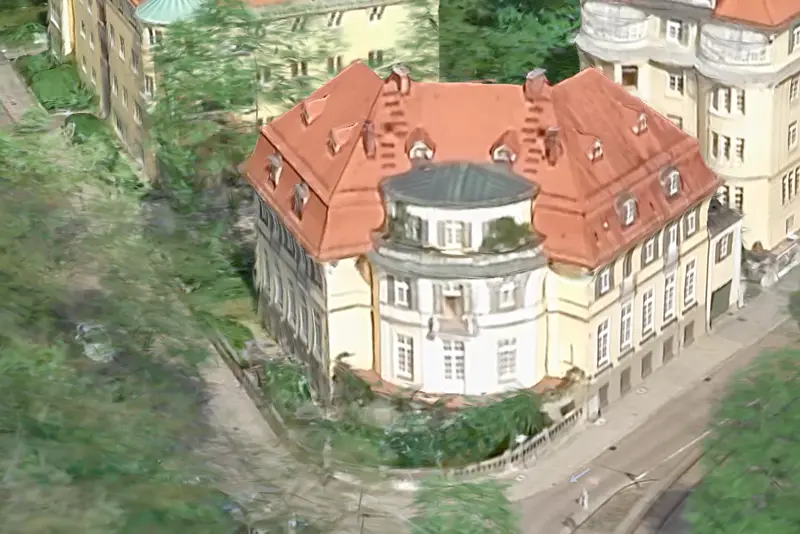
A Munich villa, a renovation budget, and every number showing its source.

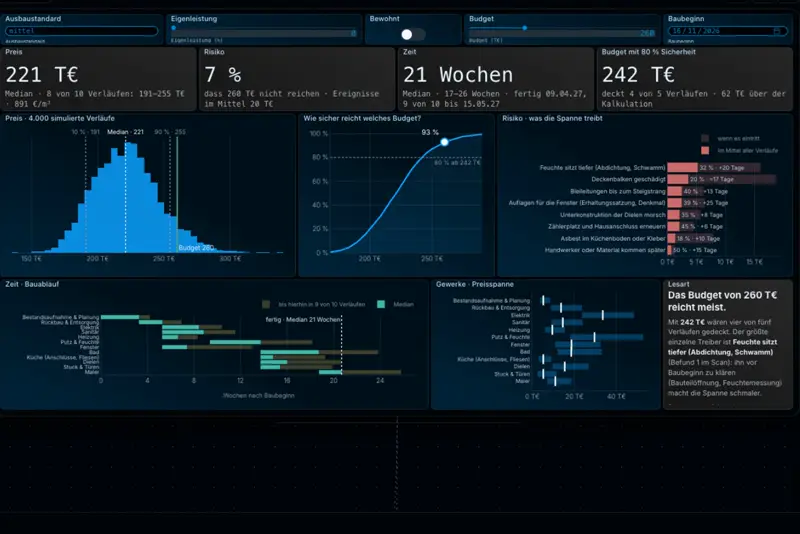
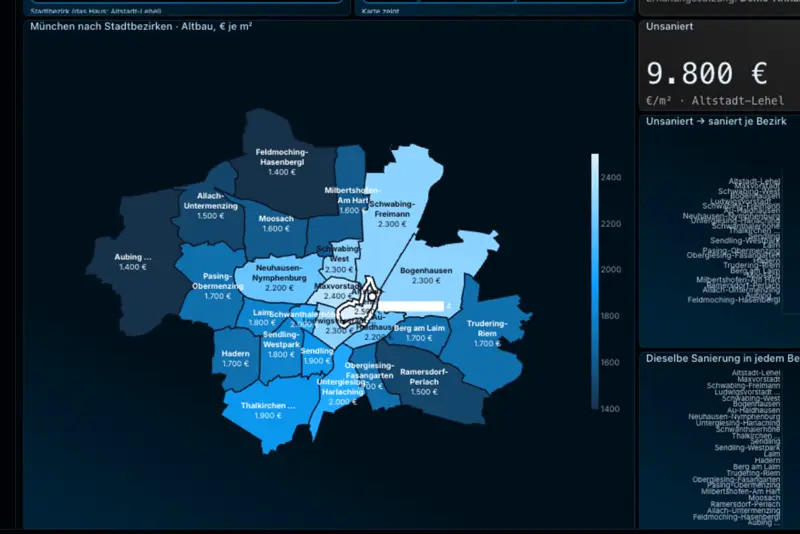
A turn-of-the-century villa in Munich-Lehel, across the street from the Englischer Garten: what does renovating the bel étage cost, how long does it take, is it worth it? The house is real, its outline surveyed, the dimensions read from photographs. Ten notebooks exchange data, nine decks show what they know: a scan with over a million Gaussian points, plot and registers, a forecast over 4,000 construction paths across 12 trades and 8 risks (219,000 € median, 21 weeks), real Eurostat building prices, Munich’s districts with real boundaries, noise and traffic as a model, the value after renovation, and three scenarios weighed by cost, time, value and risk, with expert bids merged in Delphi rounds.

Every number says where it comes from: real, read, estimated or set. What is not available (cadastre, land register, heritage list) is stated, not invented.

#built environment #real estate #renovation #monte carlo #delphi

2:39 min · German, subtitles EN/DE

Gaussian-splat scan of the villa
0:12 The scan: over a million Gaussian points
Forecast deck: price, risk, duration and budget with the simulated distributions
1:24 Forecast: 4,000 construction paths
Munich districts with renovation values per square metre
1:48 Munich by district
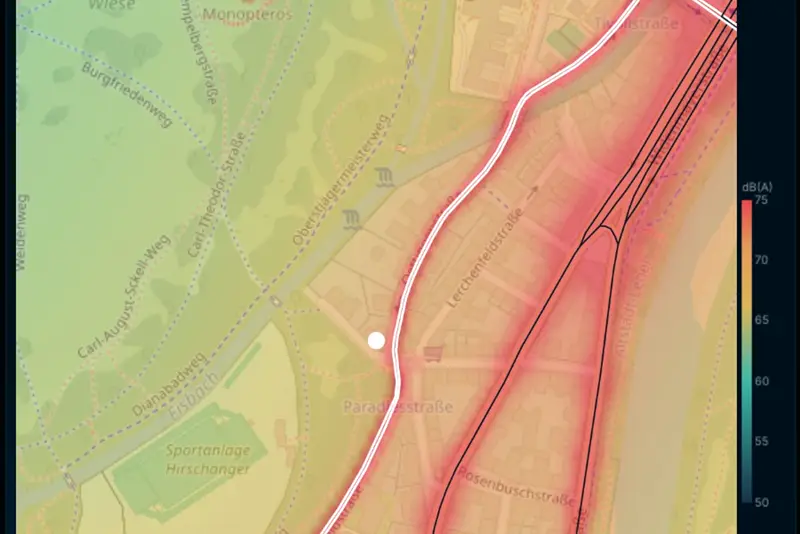
Noise map around the house
2:00 Noise and traffic model

data sovereignty

Built and hosted in the EU 🇪🇺

DataCards is developed and owned in the EU and deployed exclusively on Hetzner servers in Germany or on-prem.

made by cavorit

The team behind the platform.

Cavorit is the engineering and consulting team behind DataCards. From AI maturity workshops to full decision-model builds, we offer everything from a scoped pilot to end-to-end enablement, so your organisation doesn’t just buy a platform, it builds a capability.

industries:

  • aerospace
  • Automotive
  • Energy
  • Mechanical engineering
  • Medtech
  • Pharma
  • Maritime
  • Public infrastructure
  • Space

Meet the makers

Three partners, one crew.

DataCards is built by Cavorit in Berlin and Forst: three partners, and around them a crew from software, aviation, engineering, business and management – software architects, designers, data scientists, engineers and psychologists.

  • Portrait of Harald Fiedler

    Harald Fiedler

    CEO · Co-founder

    Political sciences and mathematics; creator of algorithms for AI-driven psychometrics. Off duty he keeps the pulse of a jazz manouche combo on the double bass.

    #strategy #statistics #data science #AI #business

  • Portrait of Prof. Hermann W. Klöckner

    Prof. Hermann W. Klöckner

    Partner · Human-AI collaboration

    Leads everything human-AI: frontends, smart data strategy, simpler interaction in complex environments. Full professor at HSA, in the historic Bauhaus buildings.

    #AI #UX #science #decision-making

  • Portrait of Dr. Eveline Mäthner

    Dr. Eveline Mäthner

    Partner · Organizational psychology

    Business and organizational psychology: the human-behaviour dimension in every project, from analysis to intervention, bringing genuine cooperation culture to life.

    #culture #business psychology #cooperation

Let’s engineer your next decision.